Google Maps Visual Design: How a Map Becomes a Living Interface
The visual evolution of Google Maps, from its early desktop map to 3D navigation: cartography, color, labels, design teams, difficult trade-offs and what comes next.

The visual evolution of Google Maps, from its early desktop map to 3D navigation: cartography, color, labels, design teams, difficult trade-offs and what comes next.
Open Google Maps to find a cafe and the screen seems obvious: a blue dot, a few roads, a handful of names and a route. But that apparent simplicity is the result of countless exclusions. A map could show every path, shop, border, building and review at once. If it did, the one turn you need would disappear.
This makes Maps a particularly interesting graphic-design product. Its artwork must change as you zoom, move, search or start driving. It also has to represent the physical world rather than invent one, while remaining readable on a phone in bright sunlight or on a car display at a glance. The question is not only whether the map looks beautiful. It is whether it helps you make the next correct decision.
We have explored similar pressures in airport wayfinding and hospital navigation. Google Maps faces those same orientation problems, but its signs must redraw themselves for almost every place on Earth.
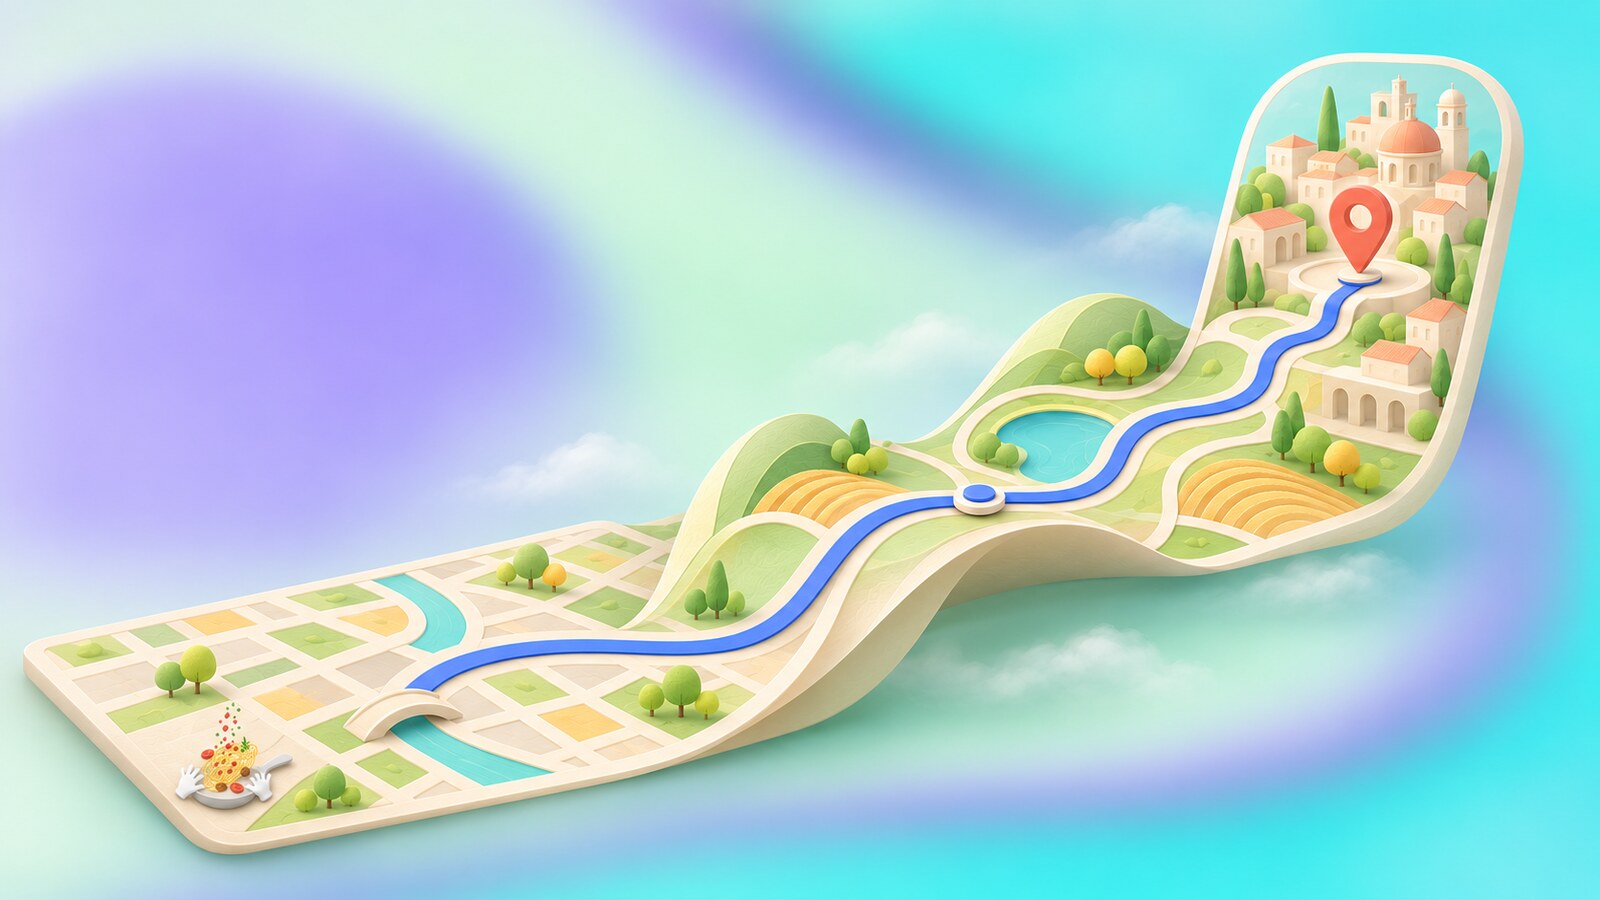
Google Maps launched for desktop on February 8, 2005. Being able to drag a map smoothly and search from one box felt unusually direct compared with the slower, page-like digital maps of the period. Over the following years, the product added Street View, mobile versions, traffic and turn-by-turn navigation. A static reference image became a live answer to “Where am I, and what should I do next?”
That expansion changed the design job. The 2005 map mainly had to show places and routes. A modern map must also help someone compare a train with a car, find an entrance, recognize an area and notice a road closure. Every additional capability competes for visual attention on the same small screen.
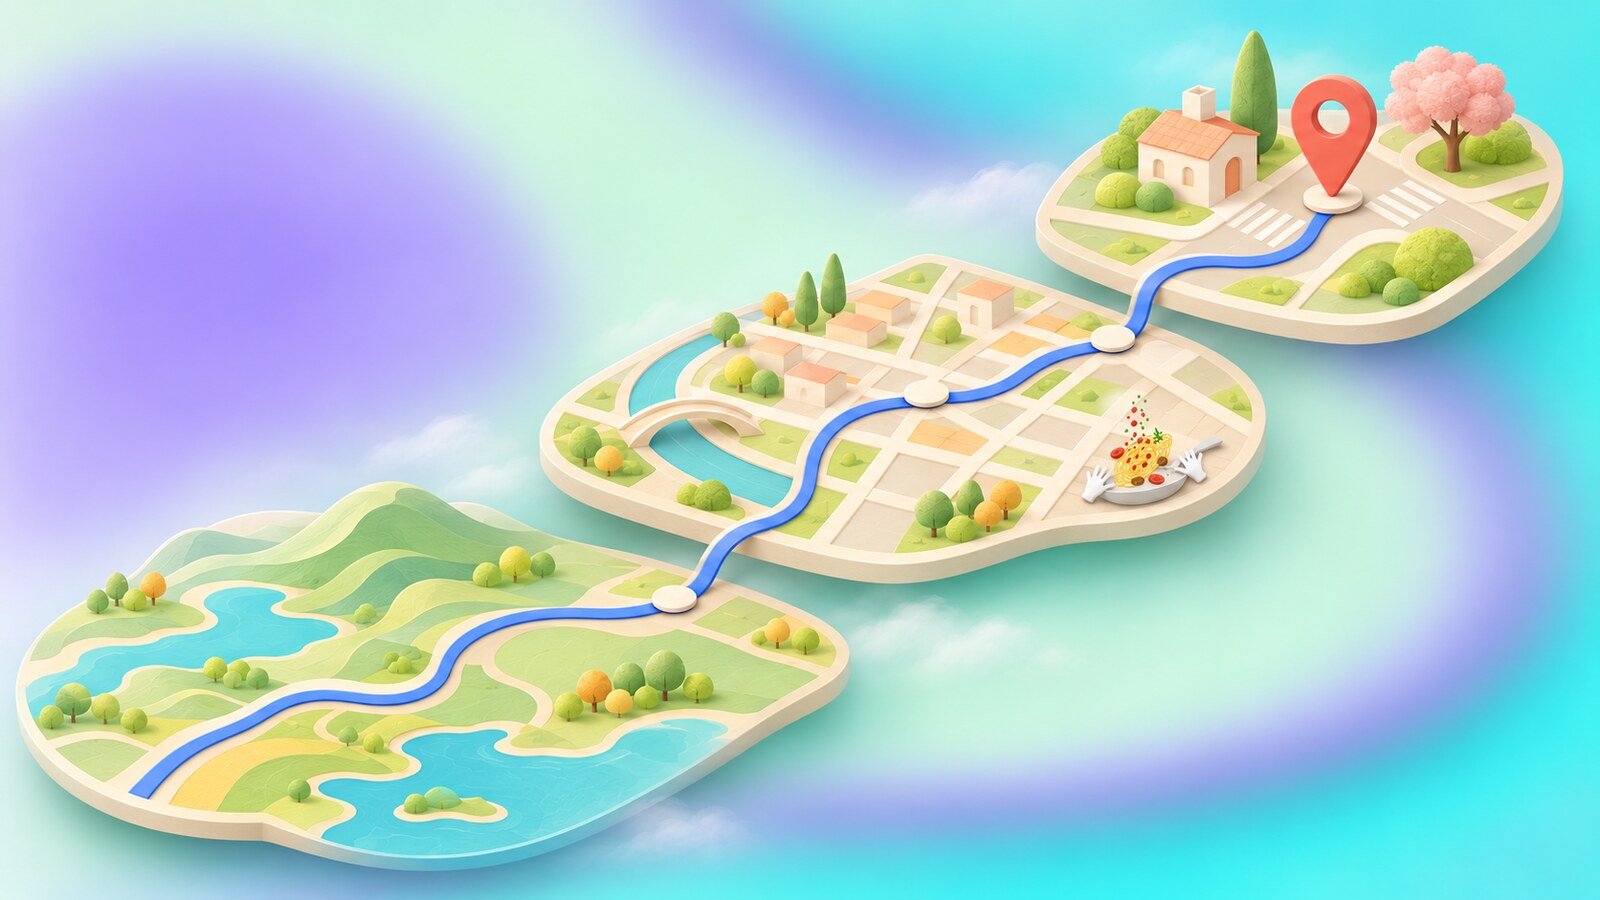
On a country view, a tiny local street is noise. At neighborhood scale, it may be the street you need. This is the special difficulty of digital cartography: the hierarchy cannot be fixed like a poster. Color, road weight, label size and points of interest must change as the zoom changes. Google Maps Platform’s styling tools even allow different rules at different zoom levels, a useful glimpse into the logic behind such a system.
The map also has several competing readers. A pedestrian needs crossings and entrances; a driver needs lanes, turns and traffic; a person exploring a city wants places worth visiting. In 2017, Google said it had made driving, transit, navigation and explore maps emphasize different information. That is better than forcing one universal layer to serve every task equally.
The visual system succeeds when it answers the current question without pretending the other two do not exist.
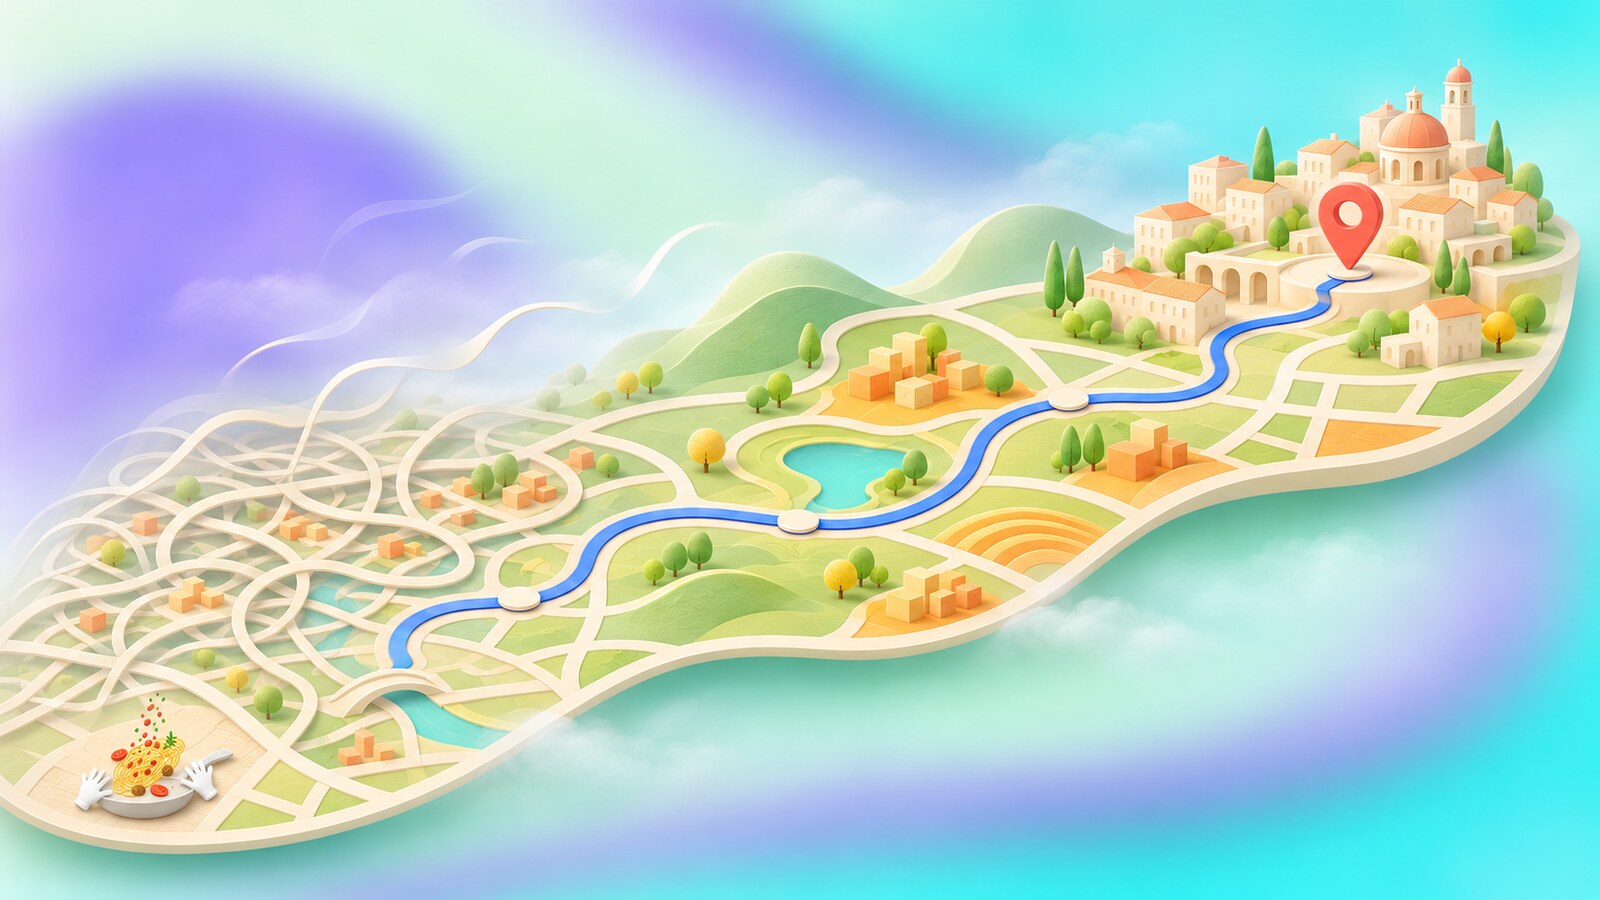
In 2016, software engineer Mark Li and Maps UX designer Zhou Bailiang described a redesign that removed some road outlines, improved the typography of street names and places, and introduced orange “areas of interest.” It was a quiet but important decision: more visible information did not require more drawn lines. The team first reduced background clutter, then used the freed space to show where activity was concentrated.
There was a human step inside that algorithmic feature. Google said the orange areas were identified from concentrations of restaurants, bars and shops, with human review for dense places such as New York City. A map is a calculated picture of reality, but someone still has to decide what a calculation should mean to a person standing on a street corner.
“The useful map is not the one that draws the most. It is the one that makes the next decision easiest to see.”
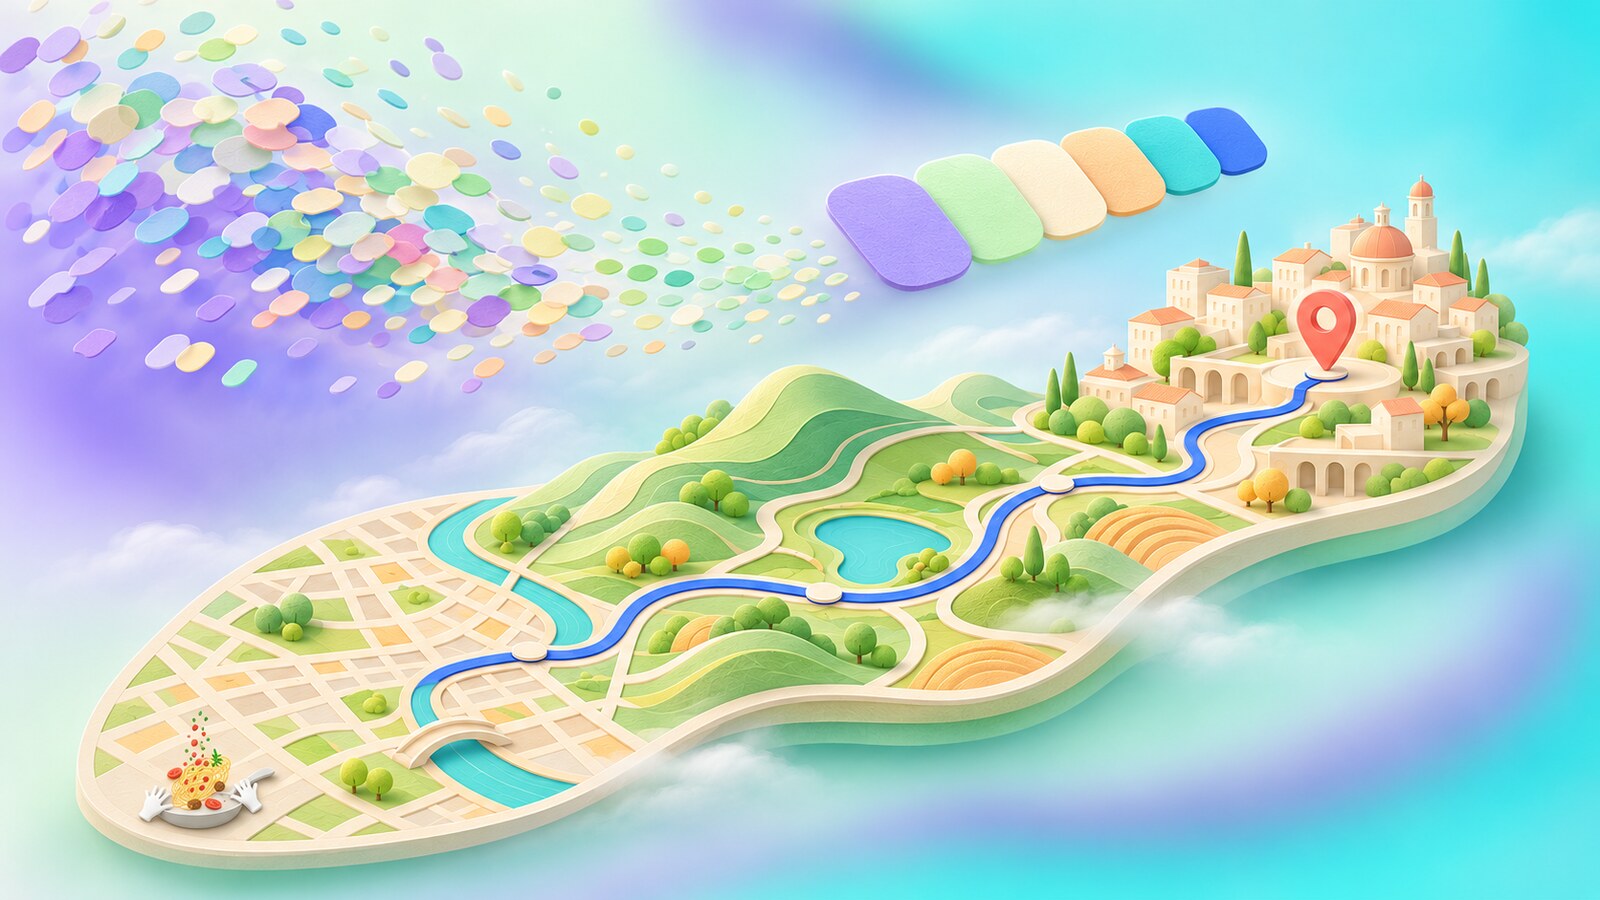
One of the least visible changes was also one of the largest. In a Google Design account of the 2020 map work, the team described reducing more than 700 map colors to 25 major and minor tones. The old system contained tiny differences between many kinds of terrain. Those differences accumulated until roads, borders and text became harder to distinguish.
This was not a lone designer choosing a prettier palette. Staff visual designer Dana Steffe worked on the color approach; creative director Sang Han, UX director David Cronin, UX design manager Diego Perez, engineer Michael Davidson and others describe the project as a collaboration between design, product and engineering. Cronin noted that some legacy color logic was not fully documented, so the team had to inspect the code to understand what already existed.
The payoff was more than tidiness. Google’s 2020 update used satellite imagery and computer vision to bring richer natural features into the map, from deserts to snow-capped mountains. A simpler palette gave that extra detail room to read. The team also built tools to inspect color relationships across places and zoom levels, rather than approving one attractive screenshot and hoping it worked everywhere.
A small design surprise: Google’s Maps team tested how the world looked in many actual regions, including tundra. A large white area might suggest permanent snow, while the real landscape beneath could be rock. Choosing a “natural” map color can require geographical research, not just taste.
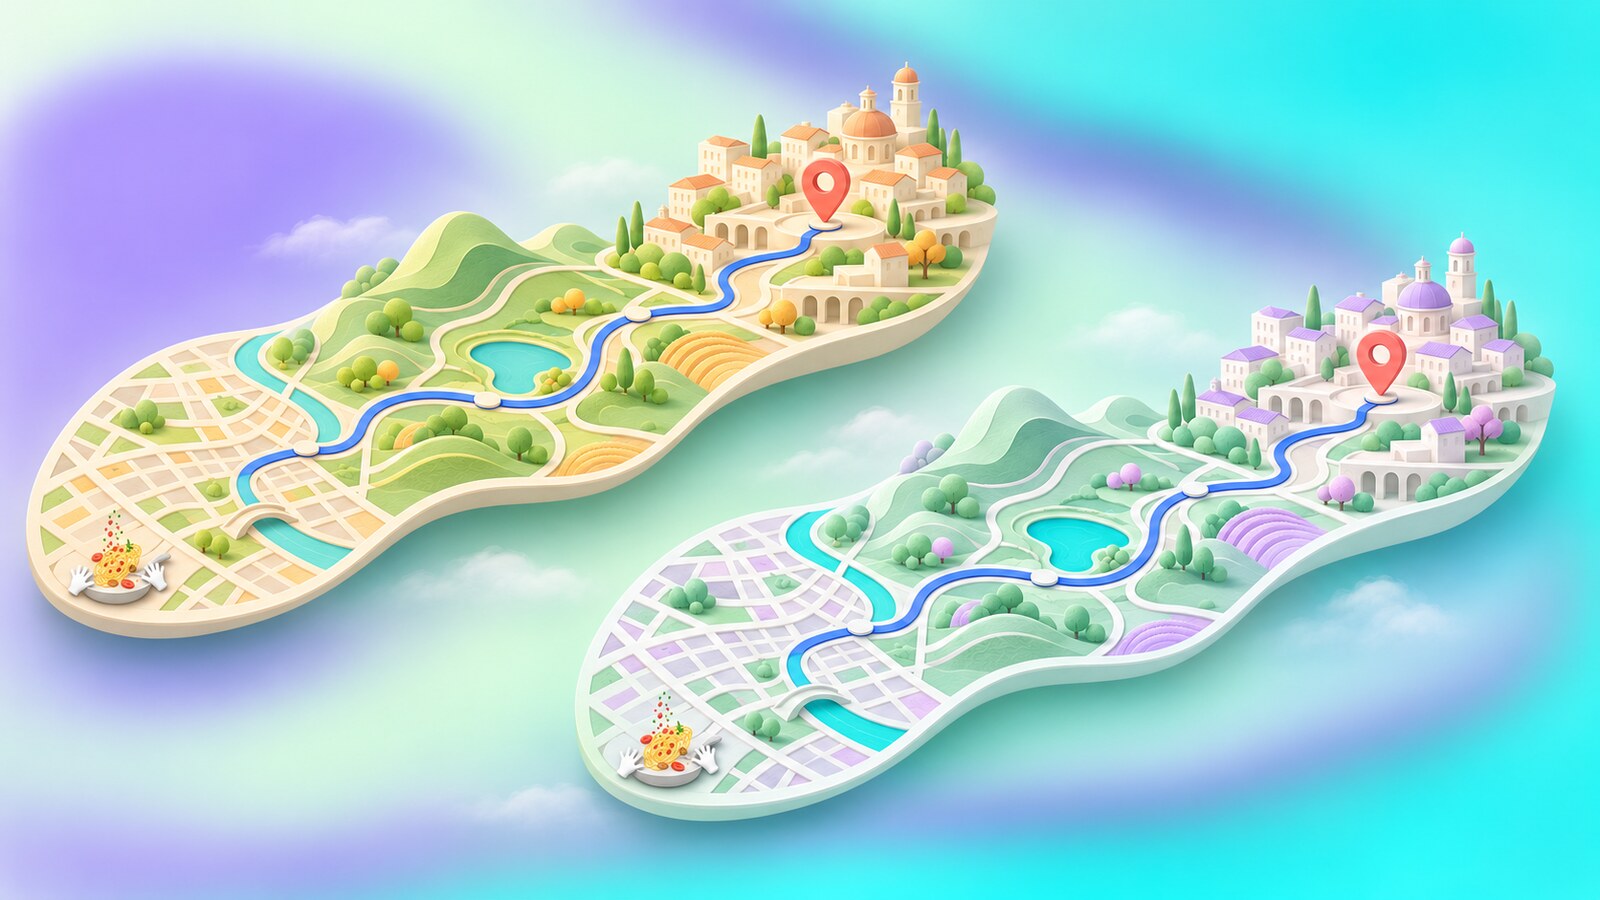
Google announced another color update in 2023 alongside more detailed navigation. It was intended to make the map feel closer to the real world, including more realistic buildings. Yet a familiar map carries learned visual habits. In Google’s support community, some users reported that the changed colors made roads or other details harder for them to distinguish. That feedback does not prove the entire redesign failed, but it points to a real risk: a map can be internally consistent and still feel less legible to some of the people who rely on it.
The difficult test is not a before-and-after beauty vote. It is whether a person can find the route line against water and roads, identify a turn at speed, or recognize a park without confusing it with another area. Color should not carry all that meaning alone; line weight, labels, icons and context have to help. For a product used in unfamiliar places, the cost of a visual mistake can be more than an ugly screen.
The wider company has faced a similar question in the evolution of Google's design: how much should a familiar visual language change when the product underneath it keeps growing?
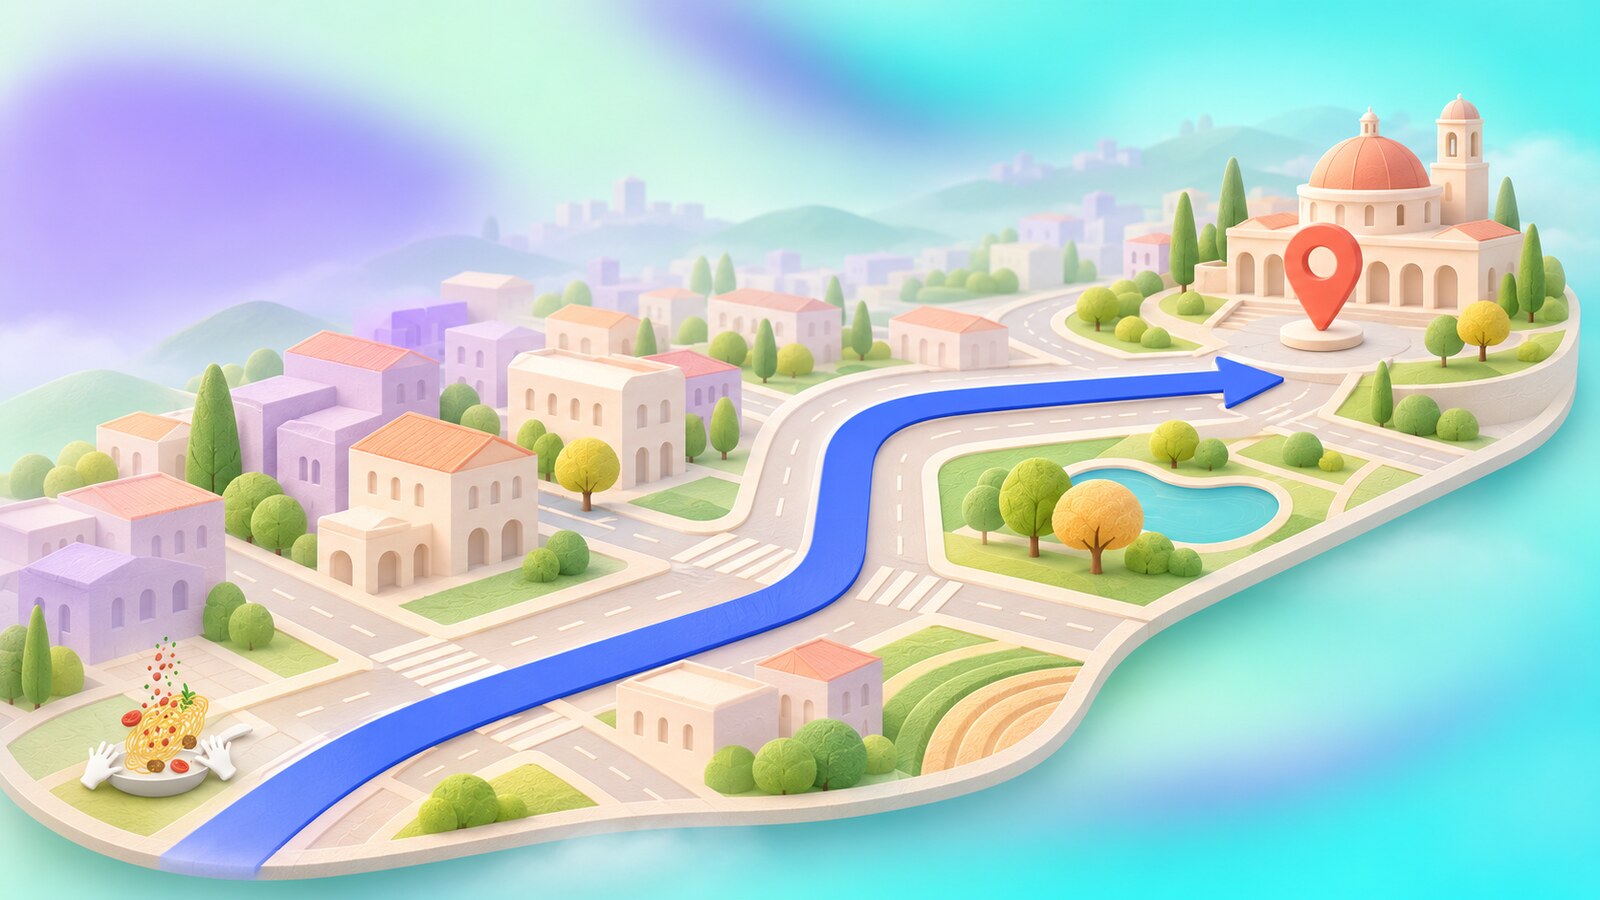
Immersive View brought aerial and Street View imagery together to preview places and routes. In March 2026, Google announced Immersive Navigation, using a 3D view, clearer lane and crossing details, smart zoom and more natural voice instructions. The company says Gemini models help analyze current imagery so the display can represent landmarks and road features more accurately.
The visual promise is obvious: seeing a recognizable building or the correct side of the street can help on the confusing final stretch. The design danger is just as obvious. Photorealistic depth, labels, route lines and alerts can crowd one another. A navigation view should make the next maneuver stronger, not bury it under a miniature simulation of everything nearby.
Google also says Maps handles more than 5 million traffic updates each second. That figure describes incoming information, not five million things a user should see. The designer’s work is to turn a huge, changing data stream into a small number of timely visual and spoken decisions.
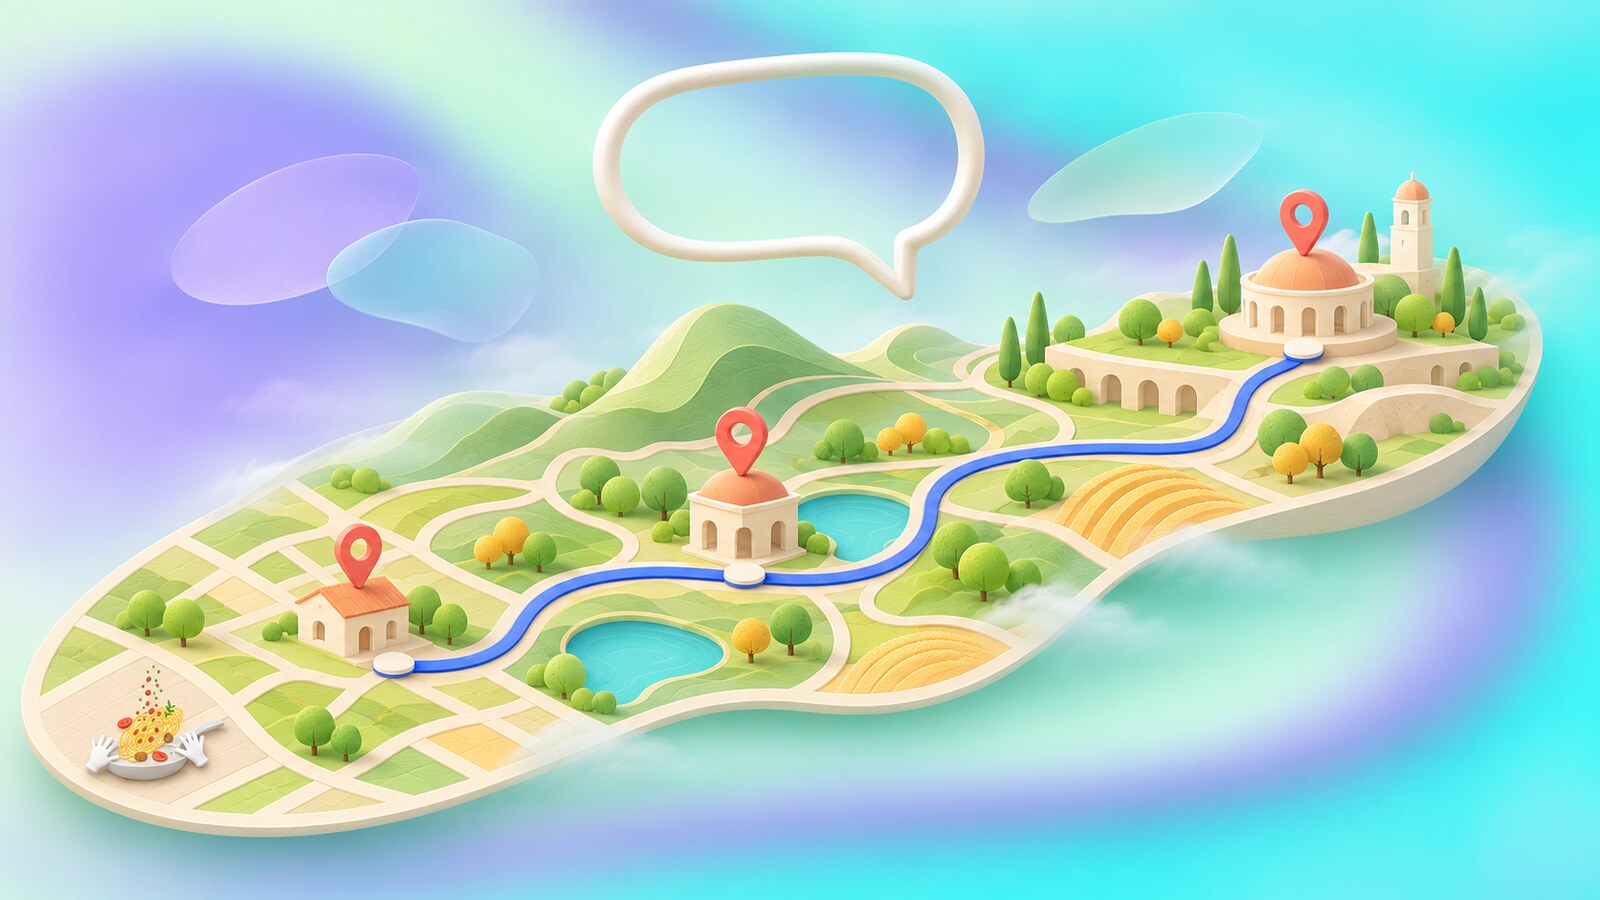
Google’s 2026 Ask Maps feature turns some searches into a conversation: a person can ask for a place that meets several conditions and see the answers on a map. That could remove a lot of manual filtering. It also creates another design problem. If an AI answer recommends three places, the map must make clear where they are, why they were selected and how to compare them without covering the geography that gives the answer meaning.
Maps has traveled from a draggable desktop picture to a layered, personalized navigation service. Its strongest visual decisions have not always been the flashiest ones. Removing a road outline, reducing hundreds of colors, or showing one entrance at the right moment can be more useful than adding another spectacular view. As maps grow more immersive, their best design principle remains simple: help people understand the place, then let them move through it.
Send us your brief, your wildest idea, or just a hello. We’ll season it with curiosity and serve back something fresh, cooked with care.